Introduction
On a Server 2016, some users had the problem that Edge would hang after starting (after Microsoft Edge was updated).
The behavior varied — sometimes Edge would hang, sometimes the entire page would remain white. Let’s take a closer look at the problem.
Initial Troubleshooting
It was relatively quick to determine that creating a new Edge profile (deleting C:\Users\%username%\AppData\Local\Microsoft\Edge\User Data\Default) solved the problem.
Normally that’s no big deal, but losing bookmarks is painful.
The good news is we now know that the problem is somehow related to the profile. We don’t need to troubleshoot anything at the machine level. The problem is somewhere in the profile.
Process Monitor
I captured a trace with Process Monitor during Edge startup and stopped it as soon as the title bar showed that Edge was frozen. I filtered on msedge.exe and summarized the Results field:
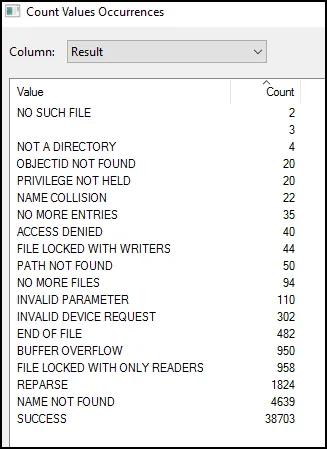
That’s a lot of events. ACCESS DENIED is always interesting to me. But what do we know so far? Only activity within the C:\users\%username%\AppData\Local\Microsoft\Edge\User Data directory is of interest. So let’s filter the log further on this property.
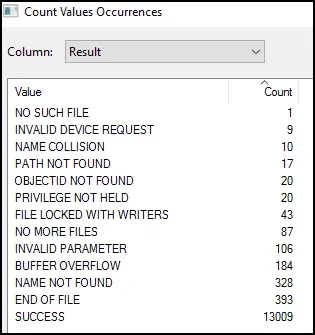
No ACCESS DENIED and a few others have disappeared. In summary, everything looks okay — no further clues for me to find.
Memory Dump
I thought it would be a good idea to take a memory dump of the process. I did this with procdump -ma {procid}. We then load the *.dmp file in WinDbg.
How do you find the right stack?
Typically, a process has multiple threads. How many? You can find out with ~ in WinDbg. In my case, I had 45 threads.
Most threads are WorkerThreads — threads waiting for work. We can usually ignore those.
A typical characteristic is that these WorkerThreads are often very “short” (~8).
The brilliant extension PDE extension by Andrew Richards makes the query easier.
We load the extension with: .load C:\path\x64\winext\PDE.dll
Then we can run !deep 15 — this command shows all call stacks with a depth of 15 or higher.
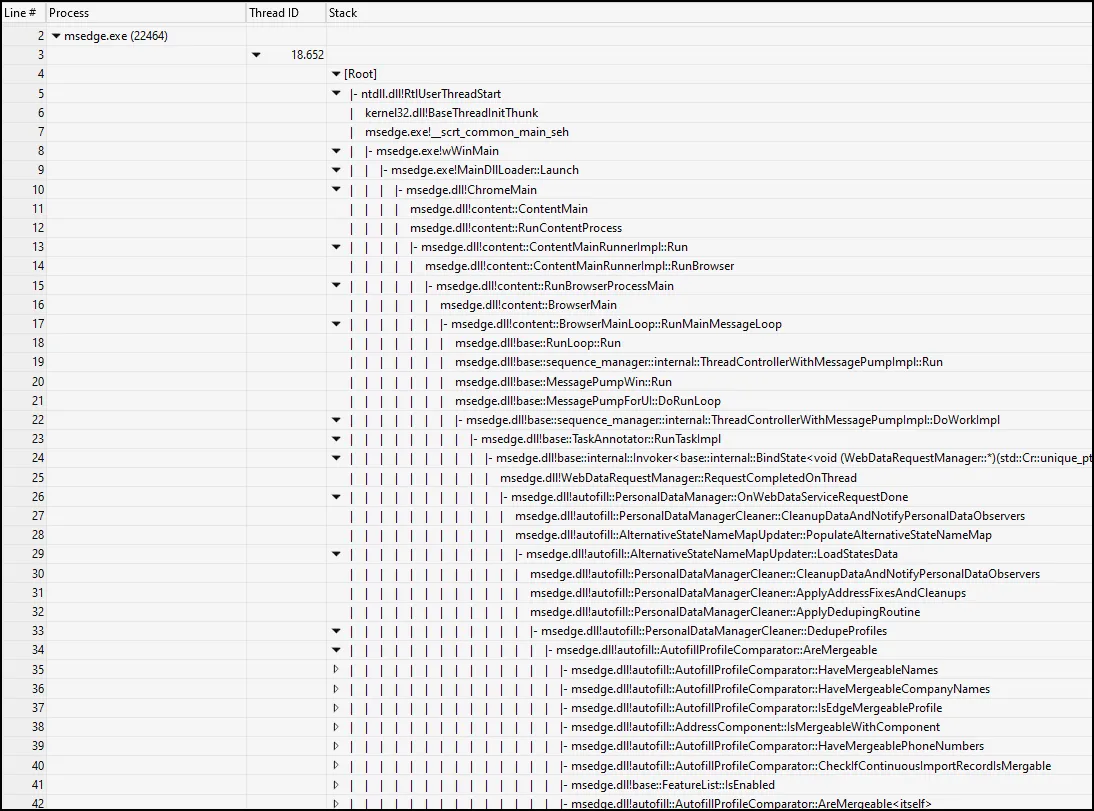
Now let’s examine the stack:
0:000> k
 # Child-SP          RetAddr               Call Site
00 000000fd`b5bfd5b0 00007ffd`d1fd189b     msedge!std::Cr::__tree<std::Cr::basic_string<char16_t,std::Cr::char_traits<char16_t>,std::Cr::allocator<char16_t> >,std::Cr::less<std::Cr::basic_string<char16_t,std::Cr::char_traits<char16_t>,std::Cr::allocator<char16_t> > >,std::Cr::allocator<std::Cr::basic_string<char16_t,std::Cr::char_traits<char16_t>,std::Cr::allocator<char16_t> > > >::__find_equal<std::Cr::basic_string<char16_t,std::Cr::char_traits<char16_t>,std::Cr::allocator<char16_t> > >+0xa2
01 000000fd`b5bfd620 00007ffd`d1fd1694     msedge!std::Cr::__tree<std::Cr::basic_string<char16_t,std::Cr::char_traits<char16_t>,std::Cr::allocator<char16_t> >,std::Cr::less<std::Cr::basic_string<char16_t,std::Cr::char_traits<char16_t>,std::Cr::allocator<char16_t> > >,std::Cr::allocator<std::Cr::basic_string<char16_t,std::Cr::char_traits<char16_t>,std::Cr::allocator<char16_t> > > >::__find_equal<std::Cr::basic_string<char16_t,std::Cr::char_traits<char16_t>,std::Cr::allocator<char16_t> > >+0x17f
02 000000fd`b5bfd6a0 00007ffd`d2e44eb8     msedge!std::Cr::__tree<std::Cr::basic_string<char16_t,std::Cr::char_traits<char16_t>,std::Cr::allocator<char16_t> >,std::Cr::less<std::Cr::basic_string<char16_t,std::Cr::char_traits<char16_t>,std::Cr::allocator<char16_t> > >,std::Cr::allocator<std::Cr::basic_string<char16_t,std::Cr::char_traits<char16_t>,std::Cr::allocator<char16_t> > > >::__emplace_hint_unique_key_args<std::Cr::basic_string<char16_t,std::Cr::char_traits<char16_t>,std::Cr::allocator<char16_t> >,std::Cr::basic_string<char16_t,std::Cr::char_traits<char16_t>,std::Cr::allocator<char16_t> > const & __ptr64>+0x50
03 000000fd`b5bfd710 00007ffd`d2e44618     msedge!autofill::AutofillProfileComparator::GetNamePartVariants+0x480
04 000000fd`b5bfd8c0 00007ffd`d2e43fd8     msedge!autofill::AutofillProfileComparator::IsNameVariantOf+0xaa
05 000000fd`b5bfdae0 00007ffd`d2e43910     msedge!autofill::AutofillProfileComparator::HaveMergeableNames+0x298
06 000000fd`b5bfdc20 00007ffd`d2e3aec5     msedge!autofill::AutofillProfileComparator::AreMergeable+0x8e
07 000000fd`b5bfdc60 00007ffd`ccddac54     msedge!autofill::PersonalDataManagerCleaner::DedupeProfiles+0x1fd
08 000000fd`b5bfdd60 00007ffd`ccdd7ced     msedge!autofill::PersonalDataManagerCleaner::ApplyDedupingRoutine+0x1e8
09 000000fd`b5bfdea0 00007ffd`ccdd7c40     msedge!autofill::PersonalDataManagerCleaner::ApplyAddressFixesAndCleanups+0x15
0a 000000fd`b5bfded0 00007ffd`ccdd90c0     msedge!autofill::PersonalDataManagerCleaner::CleanupDataAndNotifyPersonalDataObservers+0x120
0b 000000fd`b5bfdf40 00007ffd`ccdd8a1c     msedge!autofill::AlternativeStateNameMapUpdater::LoadStatesData+0xcc
0c 000000fd`b5bfe070 00007ffd`ccdd7c02     msedge!autofill::AlternativeStateNameMapUpdater::PopulateAlternativeStateNameMap+0xd0
0d 000000fd`b5bfe220 00007ffd`ccdd6eec     msedge!autofill::PersonalDataManagerCleaner::CleanupDataAndNotifyPersonalDataObservers+0xe2
0e 000000fd`b5bfe290 00007ffd`cc918780     msedge!autofill::PersonalDataManager::OnWebDataServiceRequestDone+0x43c
0f 000000fd`b5bfe390 00007ffd`cdf911e7     msedge!WebDataRequestManager::RequestCompletedOnThread+0x70
10 000000fd`b5bfe3e0 00007ffd`cdfc8142     msedge!base::internal::Invoker<base::internal::BindState<void (WebDataRequestManager::*)(std::Cr::unique_ptr<WebDataRequest,std::Cr::default_delete<WebDataRequest> >, std::Cr::unique_ptr<WDTypedResult,std::Cr::default_delete<WDTypedResult> >),scoped_refptr<WebDataRequestManager>,std::Cr::unique_ptr<WebDataRequest,std::Cr::default_delete<WebDataRequest> >,std::Cr::unique_ptr<WDTypedResult,std::Cr::default_delete<WDTypedResult> > >,void ()>::RunOnce+0x47
11 000000fd`b5bfe420 00007ffd`ca23669f     msedge!base::TaskAnnotator::RunTaskImpl+0x122
12 000000fd`b5bfe560 00007ffd`ca782a81     msedge!base::sequence_manager::internal::ThreadControllerWithMessagePumpImpl::DoWorkImpl+0x58f
13 000000fd`b5bfe870 00007ffd`cbaca689     msedge!base::MessagePumpForUI::DoRunLoop+0xcc1
14 000000fd`b5bfea40 00007ffd`cc403cfe     msedge!base::MessagePumpWin::Run+0x79
15 000000fd`b5bfeaa0 00007ffd`cc40b2ac     msedge!base::sequence_manager::internal::ThreadControllerWithMessagePumpImpl::Run+0x11e
16 000000fd`b5bfeb50 00007ffd`cc2e98f0     msedge!base::RunLoop::Run+0xfc
17 000000fd`b5bfec50 00007ffd`cc2e95cc     msedge!content::BrowserMainLoop::RunMainMessageLoop+0x9a
18 000000fd`b5bfecc0 00007ffd`cc2e8caa     msedge!content::BrowserMain+0xa4
19 000000fd`b5bfed70 00007ffd`cc2e7e42     msedge!content::RunBrowserProcessMain+0xe0
1a 000000fd`b5bfee90 00007ffd`cc2a651e     msedge!content::ContentMainRunnerImpl::RunBrowser+0x46e
1b 000000fd`b5bfeff0 00007ffd`cc1cf536     msedge!content::ContentMainRunnerImpl::Run+0x31e
1c 000000fd`b5bff140 00007ffd`cc1ce2f4     msedge!content::RunContentProcess+0x2e3
1d 000000fd`b5bff360 00007ffd`cc1cd6be     msedge!content::ContentMain+0x64
1e 000000fd`b5bff3f0 00007ff6`2ff25626     msedge!ChromeMain+0x27e
1f 000000fd`b5bff710 00007ff6`30013be2     msedge_exe!MainDllLoader::Launch+0x386
20 000000fd`b5bff9a0 00007ff6`2ffceca2     msedge_exe!wWinMain+0xf2c
21 000000fd`b5bffec0 00007ffe`4a2384d4     msedge_exe!__scrt_common_main_seh+0x106
22 000000fd`b5bfff00 00007ffe`4a9a1791     kernel32!BaseThreadInitThunk+0x14
23 000000fd`b5bfff30 00000000`00000000     ntdll!RtlUserThreadStart+0x21
You need to read the stack from bottom to top. The first lines show the normal “startup” routine. This part seems interesting:
03 000000fd`b5bfd710 00007ffd`d2e44618     msedge!autofill::AutofillProfileComparator::GetNamePartVariants+0x480
04 000000fd`b5bfd8c0 00007ffd`d2e43fd8     msedge!autofill::AutofillProfileComparator::IsNameVariantOf+0xaa
05 000000fd`b5bfdae0 00007ffd`d2e43910     msedge!autofill::AutofillProfileComparator::HaveMergeableNames+0x298
06 000000fd`b5bfdc20 00007ffd`d2e3aec5     msedge!autofill::AutofillProfileComparator::AreMergeable+0x8e
07 000000fd`b5bfdc60 00007ffd`ccddac54     msedge!autofill::PersonalDataManagerCleaner::DedupeProfiles+0x1fd
08 000000fd`b5bfdd60 00007ffd`ccdd7ced     msedge!autofill::PersonalDataManagerCleaner::ApplyDedupingRoutine+0x1e8
09 000000fd`b5bfdea0 00007ffd`ccdd7c40     msedge!autofill::PersonalDataManagerCleaner::ApplyAddressFixesAndCleanups+0x15
0a 000000fd`b5bfded0 00007ffd`ccdd90c0     msedge!autofill::PersonalDataManagerCleaner::CleanupDataAndNotifyPersonalDataObservers+0x120
0b 000000fd`b5bfdf40 00007ffd`ccdd8a1c     msedge!autofill::AlternativeStateNameMapUpdater::LoadStatesData+0xcc
0c 000000fd`b5bfe070 00007ffd`ccdd7c02     msedge!autofill::AlternativeStateNameMapUpdater::PopulateAlternativeStateNameMap+0xd0
0d 000000fd`b5bfe220 00007ffd`ccdd6eec     msedge!autofill::PersonalDataManagerCleaner::CleanupDataAndNotifyPersonalDataObservers+0xe2
0e 000000fd`b5bfe290 00007ffd`cc918780     msedge!autofill::PersonalDataManager::OnWebDataServiceRequestDone+0x43c
0f 000000fd`b5bfe390 00007ffd`cdf911e7     msedge!WebDataRequestManager::RequestCompletedOnThread+0x70
From WebDataRequestManager, the call goes further to autofill. I created another memory dump a few seconds later and saw the same stack.
We can now search for the function names and find some information about it (without reading source code).
Okay, but what can we say about it? It seems to be somehow related to autofill. And we also know that at least one file in the profile is “corrupt” and a new profile fixes the problem. The next internet search could be something like: “chromium autofill file location” and we would find this article: superuser.com article.
We learn that the “autofill” file is located at {AppData}\Microsoft\Edge\User Data\Default\Web Data… interesting.
But to be honest, that’s not exactly how it went for me, and I used another tool to narrow down the problem further.
Windows Performance Analyzer
Because ProcMon didn’t fully help, I thought an ETL trace would be a good idea. You can use Windows Performance Recorder or UIforETW for this. After capturing an .ETL trace, I use Windows Performance Analyzer to open the file. It’s best to get the version from the Microsoft Store.
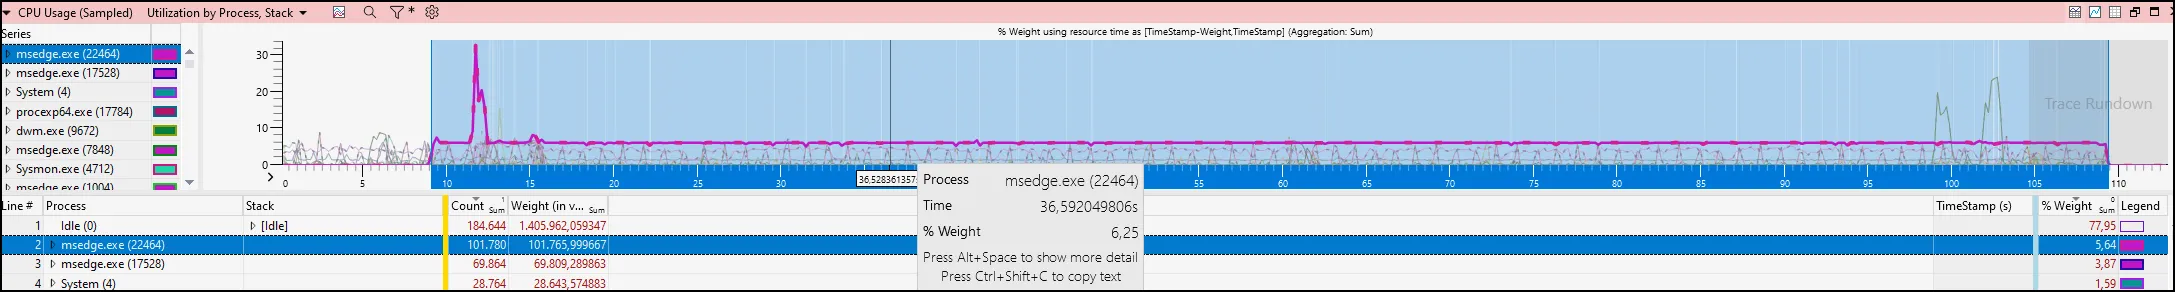
We see something we might expect. This is typically called CPU saturation, and in our case one core is fully utilized by msedge.exe (100/16 = 6.25).
We can see that the stack trace also shows the autofill — we already know this from the memory dump analysis. But we want to know exactly which file is involved.
Disk usage window
So we can select disk usage and choose Utilization by Process, Path Name, Stack.
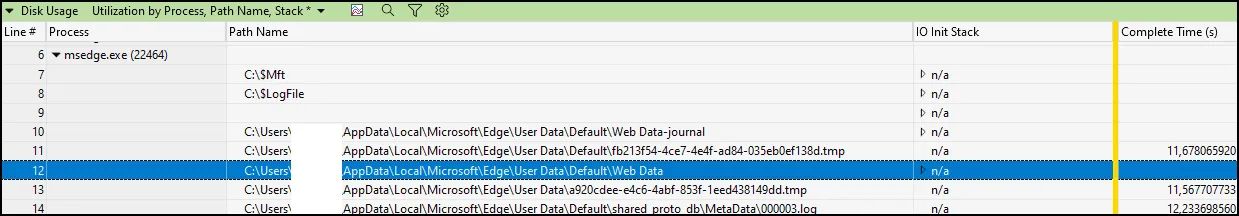
Interestingly, our friend Web Data is back. No completion time — meaning a pending file access.
If we delete this file, MS Edge opens without the window freezing.
Conclusion
We were able to find the problematic file relatively easily. ProcMon didn’t help me, but using WinDbg and ultimately WPA, I found exactly the file I was looking for.
The problem itself is somewhat strange. Sometimes I restored an old Web Data directory (to reproduce the problem) — but it worked. I also had a case where I waited a very long time (>1h?) and then it fixed itself and worked again.
Happy troubleshooting.